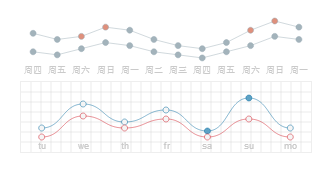
Site traffic widget on html5 canvas
Features:
- Build a graph based on data array;
- Build a graph based on Yandex.Metrica counter;
- Partial or complete customization;
- Graph built using Html5 canvas;
Usage:
Example
Methods
| Method | Parameters | Description |
|---|---|---|
$informer(canvasID, [options]) |
|
Initializes the module; Return value: module instance; |
.showStat(graph_type, data, [style]) |
|
Build the desired graph from an array of data and styling settings; |
.showYandexStat(graph_type, counter_id, [style]) |
|
Build the desired graph from an array of data provided Yandex.Metrica analytics tool. Caution:
|
.redraw() |
- | Redrawing graphs on canvas. |
Module settings
$informer(canvasID, options)
| Parameter | Type | Default value | Description |
|---|---|---|---|
font |
string | '10px Sans-Serif' |
Used font. |
fontColor |
'#97A9B2' |
Font color. | |
hintBg |
color | '#A3B3BB' |
Background color of the hint. |
hintTextColor |
color | '#fff' |
Hint font color. |
hintScale |
int (%) | 120 |
Scale area around the element that triggers the tooltip. |
showCaption |
bool | false |
Show your caption to the graph. |
caption |
string | 'metrika.yandex.com' |
Caption text. |
showGrid |
bool | false |
Show grid. |
showDayOfWeek |
bool | true |
Show weekdays. |
weekDays |
Array | ['su', 'mo', 'tu', 'we', 'th', 'fr', 'sa'] |
An array of weekdays. |
showDaysOfMonth |
bool | false |
Show days of the month. |
Example:
var stat1 = $informer('informerID', {font: 'bold 10px Arial', fontColor: '#f00'});
Show statistics graph
.showStat(graph_type, data, [style])
.showYandexStat(graph_type, counter_id, [style])
Parameters:
| Parameter | Type | Description |
|---|---|---|
graph_type |
string |
Graph type. Available chart types:
You can use one of the available types of graphics or create your (manual). Each type of graph its own set of styles. |
data |
object |
Data on the number of visitors and page views:
You also can open public access to statistics and use of Yandex.Metrica API to obtain site visits data. |
counter_id |
string |
Yandex.Metrica counter number. Makes a request for data on page views statistics at Yandex server, then
formed a set of data on pageview and call Caution:
|
style |
object |
For each type of graph designed its own set of styling.
Styling for
Styling for
|


comments: